07. Radar Range Equation
Radar Range Equation
L1A64 Radar Equation
Range Equation Overview
Range Equation
Using the Radar Range equation we can design the radar transmitter, receiver, and antenna to have the desired power, gain and noise performance to meet the range requirements.
A long range radar designed to cover 300m range and detect a target with smaller cross section would need higher transmit power and more antenna gain as compared to a short range radar designed to cover just 50m for similar target. A target with higher cross section can be detected at a longer range as compared to a target with smaller cross section.
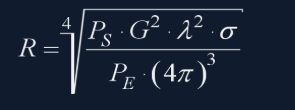
- R - Maximum Range a radar can detect targets.
- P_s - Transmitted Power from Radar (dBm)
- G - Gain of the Transmit/Receive Antenna (dBi)
- \lambda - Wavelength of the signal ( m )
- \sigma - radar cross section ( m^2 )
- P_E - Minimum received power radar can detect.
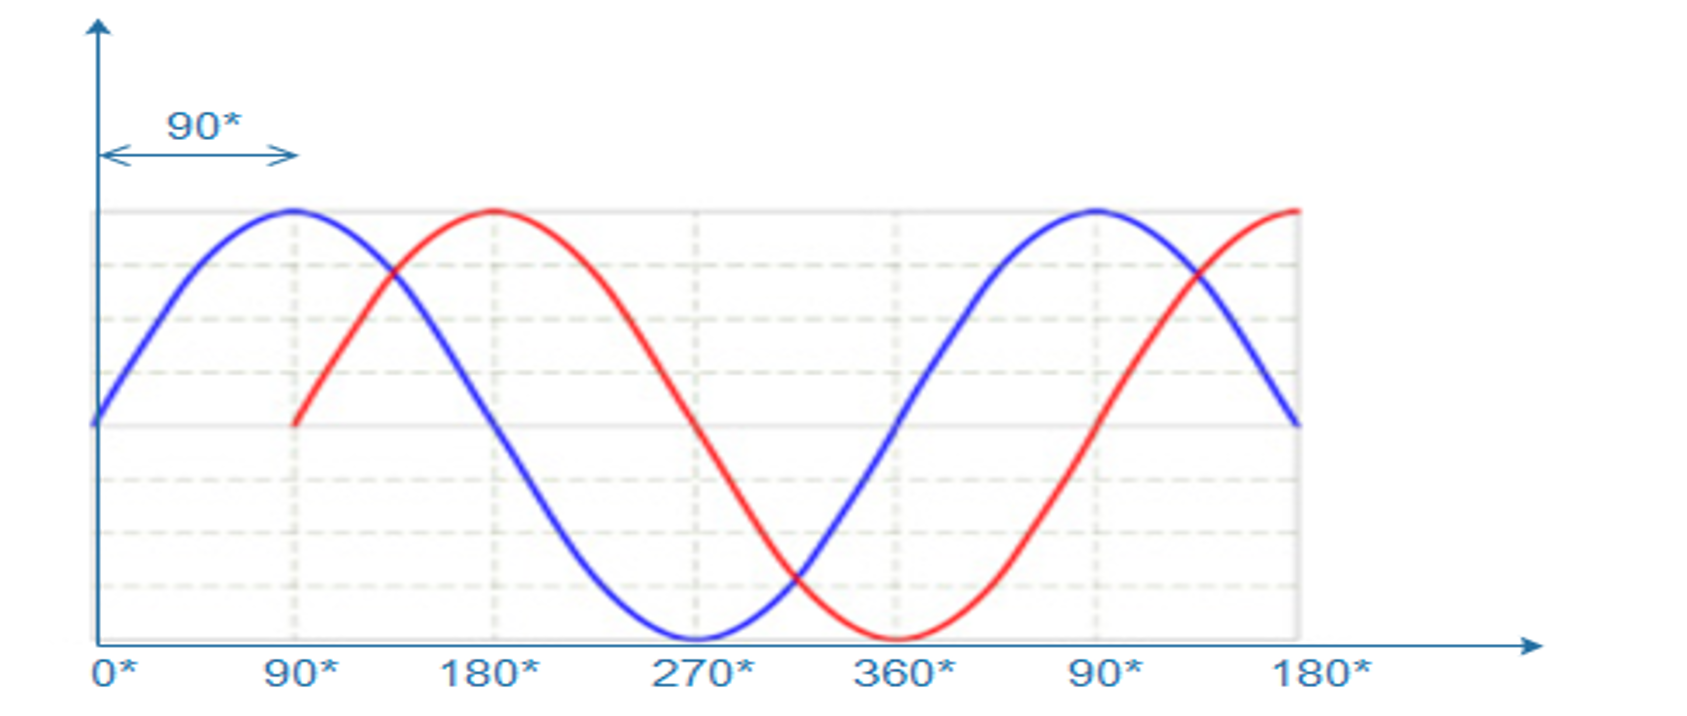
The image above shows the variation in the signal strength level as it travels through transmitter, over the air and at the receiver
The image above shows the variation in the signal strength level :
- The transmitter power
- Power Amplifiers further increase the signal strength - Transmit chain gain
- Signal is further amplified using an antenna
- One Way Path Loss represents the loss in the signal strength as it travels towards the target
- On getting reflected from the target the signal gets amplified based on the RCS of the target
- After RCS gain the signal travel back towards the radar and has similar loss in strength as going forward
- The receiver antenna amplifies the return signal before sending it to the processing unit
Range Equation Quiz
Range Equation
SOLUTION:
- Higher Antenna Gain
- Higher Transmitter Power
Radar Detection
SNR
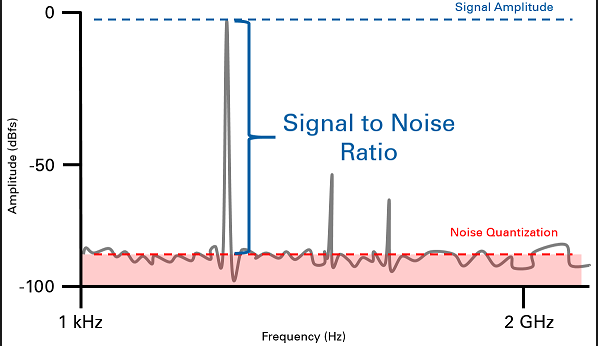
Below is an illustration showing the output of a radar's range detection. The peaks correspond to the strength of the return signal from targets and the frequency relates to the range. Relationship between frequency and range will be discussed in next lesson.
A radar cannot detect a signal that is below the noise level. The noise level is determined by the thermal noise generated by the receiver. To successfully detect a target, the return signal strength needs to be larger than the noise level. This is defined by a property called signal to noise ratio , or _SNR.
SNR is a quantitative measure of a signal strength as compared to the level of noise. If the SNR is too low it becomes difficult for a radar to distinguish the signal from noise. Hence, higher SNR is desirable for successful detection of the target. Generally, a 7-13 dB SNR ensures successful detection in a road scenario.
SNR
Signal to Noise Ratio
The image above shows the logarithmic value of SNR = power level (in dBm) - noise level (dBm). The plot shows the output of Range FFT (discussed in Lesson 2). In general, the higher the SNR value, the greater are the chances of successful Radar detection.
Matlab Exercise: Maximum Range Calculation
The following MATLAB code provides some parameters which can be used in the range equation given above. Your task is to complete the TODOs in the following code:
- Use the speed of light c to compute the wavelength \lambda .
- Use the results from part 1. along with the range equation to compute the radar range.
-
Print the range to screen using
disp(range).
MATLAB Starter Code
%Operating frequency (Hz)
fc = 77.0e9;

%Transmitted power (W)
Pt = 3e-3;

%Antenna Gain (linear)
G =  10000;

%Minimum Detectable Power
Ps = 1e-10;

%RCS of a car
RCS = 100;

%Speed of light
c = 3*10^8;

%TODO: Calculate the wavelength


%TODO : Measure the Maximum Range a Radar can see.